tiktok-ad-analytics
TikTok Ad Analytics: A Complete Guide to Tracking and Optimizing Campaign Performance
By
Kinnari Ashar

Every impression, view, click, and conversion leaves a trail. TikTok ad analytics helps you read that trail. Advertisers analyze reporting from TikTok Ads Manager, conversion events tracked through TikTok Pixel or app tracking, and performance data available through the TikTok Marketing API to understand how campaigns actually behave.
These insights reveal which creatives grab attention, which audiences respond to, and which campaigns generate revenue. TikTok’s algorithm rewards strong performance signals, which makes careful analysis the fastest way to uncover ads that can scale.
In this guide, you will learn how TikTok ad analytics works and how marketers turn raw campaign data into smarter advertising decisions.
What TikTok Ad Analytics Actually Means?
Running ads on TikTok produces a constant stream of performance data. Every view, click, and purchase recorded during a campaign reveals how people respond to your advertising. TikTok ad analytics focuses on studying this information so you can understand what actually happens after an ad enters the feed.
In simple terms, TikTok ad analytics refers to the measurement and interpretation of data generated by paid advertising campaigns on TikTok. The goal is to understand how users interact with ads and how those interactions translate into business outcomes.
Analytics tracks several key performance areas.
Ad delivery and distribution: This shows how frequently your ads appear and how impressions are spread across audiences.
Audience engagement with video creatives: Metrics such as views, watch duration, likes, comments, and shares reveal how viewers react to the content itself.
Traffic generated through ad clicks: Click data shows how often viewers move from the ad to a website, product page, or app store.
Conversion events: Advertisers track actions such as purchases, registrations, or app installs to measure whether campaigns produce meaningful outcomes.
Revenue attribution: Sales data connects completed purchases to the campaigns responsible for driving them.
Advertisers analyze campaign performance through Ads Manager dashboards, generate custom reports for deeper analysis, track conversions using attribution tools such as TikTok Pixel or app event tracking, and retrieve structured reporting data through the TikTok Marketing API.
Where TikTok Ad Analytics Data Comes From?
1. TikTok Ads Manager Analytics Dashboard
TikTok Ads Manager is the primary place where you monitor campaign analytics and advertising performance. Once campaigns begin delivering ads, the dashboard gathers performance signals and organizes them into reports that help you understand how audiences interact with your ads.
The dashboard presents a real-time overview of campaign activity. You can review ad spend, impressions, engagement signals, click activity, and conversion data in a single interface. This overview allows you to quickly determine whether campaigns are generating attention, traffic, and meaningful results.
Analytics data is organized according to TikTok’s campaign hierarchy. Each level reveals a different layer of performance insight.
Campaign level: The campaign level shows an aggregated summary of performance across all associated ad groups and ads. Metrics such as total impressions, total spend, and overall conversions appear here. This view helps you evaluate campaign efficiency and determine how the advertising budget performs across different initiatives.
Ad group level: The ad group layer focuses on targeting configuration and delivery settings. Analytics at this level reflect audience demographics, placement selections, and bidding strategies. By studying ad group performance, you can identify which audience segments respond most strongly to your advertising.
Ad level: The ad level provides detailed data for individual creatives. Each video, caption, and creative variation receives its own performance metrics. This makes it easier to identify which content formats generate higher engagement, stronger click activity, and more conversions.
2. TikTok Custom Reporting System
Campaign dashboards show performance quickly, yet comparing results across multiple campaigns can become messy when data spreads across several views. TikTok’s custom reporting system allows you to organize campaign analytics into structured reports built around the metrics you want to examine.
With custom reporting, advertisers can arrange large datasets into clear tables that highlight the information most relevant to campaign analysis. This makes it easier to study performance across campaigns, ad groups, creatives, and audience segments without navigating different dashboard screens.
The reporting system includes several capabilities. You can select specific performance metrics such as impressions, clicks, conversions, and cost-related indicators. Reports can also be segmented using dimensions like audience demographics, location, device type, placement, or time period.
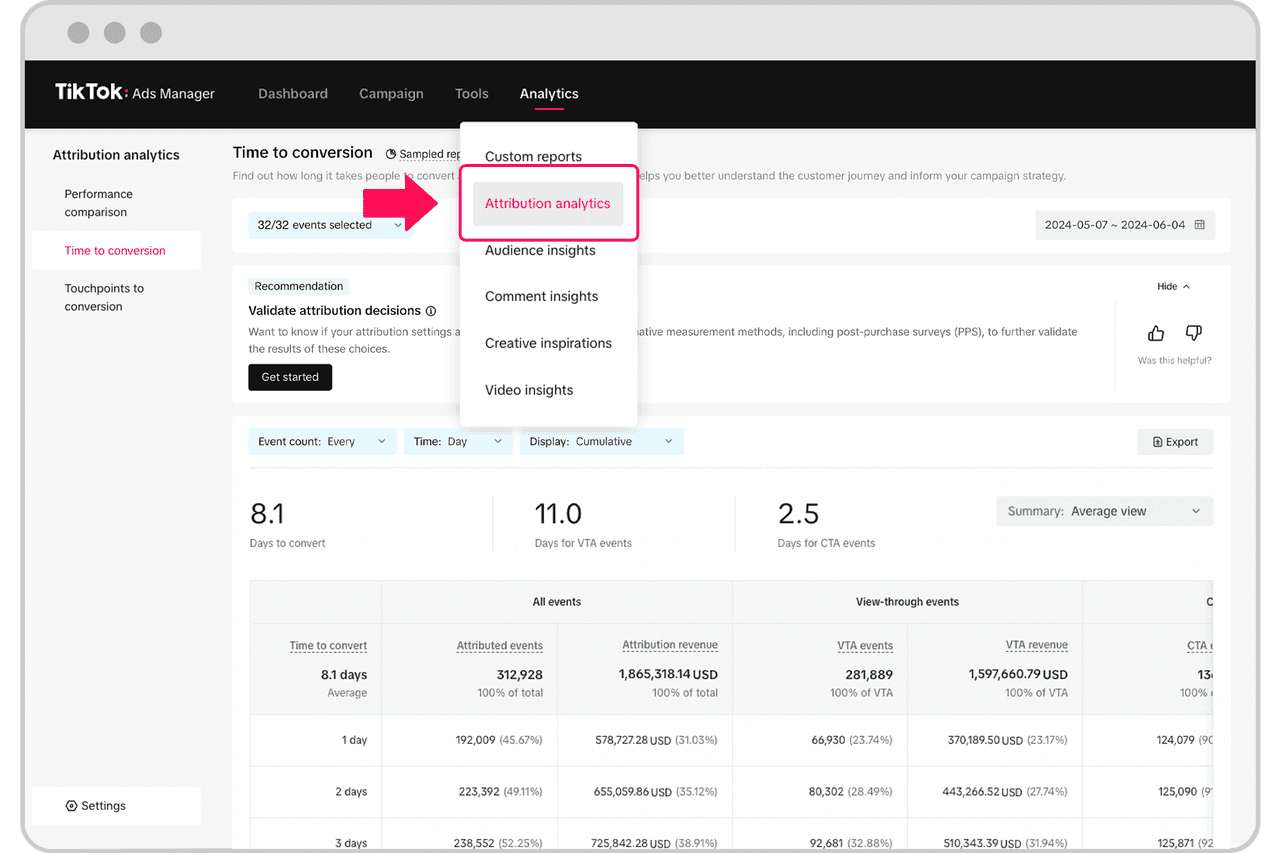
3. Attribution Analytics and Conversion Tracking
Engagement metrics reveal how viewers interact with an ad, but they do not show whether that interaction leads to revenue. Attribution analytics fills this gap by connecting ad exposure with the actions users take afterwards, allowing advertisers to see which campaigns actually drive business results.
This connection relies on event tracking systems that record user activity after someone clicks or views an advertisement.
For websites, advertisers install the TikTok Pixel, which tracks behavior across product pages, shopping carts, and checkout flows. Mobile apps use app event tracking, allowing campaigns to measure installs and actions that happen inside the application.
E-commerce advertisers typically monitor several conversion events:
Add to cart
Checkout initiation
Purchase completion
Lead submission
Account registration
Once these events are recorded, TikTok links them back to the campaigns responsible for generating them.
4. Reporting Through the TikTok Marketing API
Large advertising teams often manage dozens of campaigns, creatives, and audience segments at the same time. Reviewing performance manually inside Ads Manager becomes difficult once reporting needs expand across multiple accounts or longer time periods.
The TikTok Marketing API addresses this issue by allowing developers and marketing platforms to access advertising data programmatically.
Through the API, systems can request structured campaign analytics directly from TikTok. Instead of exporting reports manually, advertisers can collect performance datasets automatically and route them into internal analytics environments.
Reporting endpoints provide several categories of campaign data.
Campaign delivery metrics: These datasets show how ads distribute across the platform. Advertisers can review impressions, reach, spend, and overall delivery patterns across campaigns.
Engagement data: This dataset captures how viewers interact with ad creatives. Metrics include video views, watch duration, likes, comments, and shares.
Click activity: Click metrics reveal how often viewers move from an advertisement to a landing page, ecommerce store, or app listing.
Conversion events: These datasets record actions tracked through systems such as TikTok Pixel or app event tracking. Events often include purchases, registrations, installs, or other actions triggered after ad exposure.
Revenue metrics: Sales-related data connects completed purchases with the campaigns responsible for generating them. Advertisers use these metrics to evaluate return on ad spend and overall campaign profitability.
TikTok Ad Analytics Metrics Explained
TikTok advertising generates a wide range of performance indicators. To make the analysis easier, these indicators are grouped into several major metric categories.
1. Delivery Metrics (Ad Distribution)
Delivery metrics measure how broadly advertisements are distributed among TikTok Ads users. These signals reveal whether campaigns receive sufficient exposure and whether the advertising budget produces efficient reach across the platform.
Impressions: Impressions represent the total number of times an advertisement appears on user screens. Each appearance of the ad counts as a separate impression, even when the same viewer encounters the ad more than once.
This metric shows how frequently a campaign enters user feeds.
Reach: Reach measures the number of unique users who see an advertisement. While impressions record every appearance, reach focuses on how many individual viewers receive at least one exposure to the ad.
This indicator helps advertisers understand the size of the audience their campaign touches.
Frequency: Frequency calculates how often the same user sees a specific advertisement on average. The value comes from dividing total impressions by unique reach.
Monitoring frequency helps advertisers evaluate whether viewers encounter a creative enough number of times to remember it without feeling overwhelmed by repetition.
CPM (Cost Per Thousand Impressions): CPM reflects the cost required to generate one thousand ad impressions. This metric shows how much advertisers pay to distribute ads across TikTok feeds and helps measure the cost efficiency of campaign delivery.
2. Engagement Metrics (Viewer Interaction)
Exposure alone does not determine whether an advertisement works. Once the video appears in the feed, the next question is how viewers respond to it.
Engagement metrics capture these reactions and help you evaluate whether the creative attracts attention, encourages interaction, and keeps viewers watching long enough to understand the message.
Likes: Indicate quick approval from viewers. A rising like count usually signals that the creative feels appealing or entertaining during the first few moments of the video.
Comments: Reveal how viewers react in their own words. Some users ask questions about the product, others react to the demonstration, or share opinions about the video. Reviewing comment patterns can uncover audience sentiment and common concerns.
Shares: Shares occur when viewers send the advertisement to friends or repost it through TikTok’s sharing tools. This action often signals that the content feels interesting enough for viewers to recommend it to others.
Video views: Record how often the advertisement begins playing in user feeds. While this metric reflects playback activity, it becomes more meaningful when combined with view duration data that shows how long viewers stay with the video.
Completion rate: Measures how many viewers watch the entire video. When a large portion of viewers stays until the end, the creative usually maintains attention and delivers the message clearly.
TikTok also tracks several viewing thresholds that reveal how long viewers remain engaged with a video.
2-second video views: This threshold captures viewers who stay long enough to see the opening moment of the ad. Low numbers often indicate that the first frame fails to stop the scroll.
6-second video views: This metric shows how many viewers continue watching after the initial hook, offering a clearer signal of early engagement.
50% completion: This indicator tracks viewers who watch at least half of the video, helping advertisers understand whether interest continues through the middle of the ad.
100% completion: This metric records viewers who watch the video from beginning to end.
3. Click Metrics (Traffic Generation)
Click metrics measure how effectively advertisements drive traffic to external destinations such as websites, landing pages, or app stores.
Clicks: Total number of times users tap the ad link.
CTR (Click Through Rate): Percentage of impressions that lead to a click. A higher CTR usually indicates that the creative and call to action persuade viewers to explore further.
CPC (Cost Per Click): Average amount paid for each click generated by the advertisement.
These metrics show how effectively an ad converts viewer attention into traffic.
4. Conversion Metrics (Campaign Outcomes)
These indicators measure the actions users complete after interacting with an advertisement, helping advertisers evaluate whether campaigns produce real business results.
Conversions: Number of completed actions generated by the campaign, such as purchases, signups, or app installs.
Conversion rate: Percentage of visitors who complete a desired action after clicking the advertisement.
Cost per conversion: Average amount of advertising spend required to generate one completed action.
Total conversion value: Total monetary value generated from recorded conversion events.
For ecommerce campaigns, advertisers usually track several purchase related events. These commonly include add to cart, checkout initiation, and completed purchase, which help measure how users move through the buying process after interacting with an ad.
5. Revenue Metrics (Profitability)
Revenue metrics determine whether advertising campaigns produce profitable outcomes. These indicators connect advertising spend with the sales generated from campaign activity.
ROAS (Return on Ad Spend): Revenue generated for every dollar spent on advertising.
Total revenue: Total sales value attributed to advertising campaigns.
Cost per purchase: Average advertising cost required to generate one completed sale.
Advanced Analytics Segmentation for Deeper Insights
Overall campaign metrics provide a general performance view, but deeper insights often appear only after the data is broken into smaller segments. Segmentation allows advertisers to analyze results across different campaign dimensions and uncover patterns hidden inside aggregated numbers.
TikTok analytics commonly allows segmentation by:
Campaign ID
Ad group
Creative ID
Audience demographics
Geographic location
Device type
Ad placement
These dimensions help isolate where performance differences actually occur.
For example, a campaign may show moderate overall ROAS. When results are segmented by geographic location, one country may produce significantly higher purchase rates while other regions generate minimal revenue.
Another common discovery appears when analyzing results by creative ID. One video variation may deliver a much higher CTR simply because the opening scene captures attention more effectively than the others.
How Advertisers Use TikTok Ad Analytics to Optimize Campaigns
Step 1: Evaluate Creative Performance
Advertisers begin by reviewing how the ad creative performs using metrics such as engagement rate, completion rate, click-through rate, and watch time. These indicators show whether viewers stay engaged with the video or leave early.
A noticeable drop in the first few seconds usually signals that the opening fails to capture attention. Ads that perform well tend to start with visually striking moments or clear hooks that make viewers pause and continue watching.
Step 2: Analyse Audience Performance
Advertisers review campaign data to understand which audience segments respond best to the ad. This analysis highlights where engagement and conversions are strongest.
Performance differences can appear across:
Age groups
Geographic regions
Device types
Audience interests
These insights help advertisers refine targeting and focus campaigns on audience segments that generate stronger results.
Step 3: Adjust Budget Allocation
Budget distribution changes once performance patterns become clear. Campaigns producing stronger return on ad spend usually receive additional funding, while weaker ad groups lose priority or get paused.
Common actions during this stage:
Increasing spend on ads, generating consistent conversions
Stopping ad groups that fail to deliver results
Moving the budget toward audiences driving purchases or leads
Revenue and conversion data guide these shifts, helping advertisers place spending where it produces the highest return.
Step 4: Test and Iterate Creatives
Strong TikTok campaigns rarely rely on a single ad version. Marketers constantly introduce new creative variations to see what captures attention and drives action.
Typical experiments focus on elements such as:
Alternative opening hooks in the video
Different captions or messaging styles
Varied text overlays within the footage
New ways of showing the product in action
Changes in the landing page connected to the ad
Performance data from these experiments reveals which versions resonate with viewers, allowing marketers to refine future creatives and drop formats that fail to generate engagement.
Key Insights Advertisers Discover From TikTok Ad Analytics
Creative Performance Often Determines Campaign Success
On TikTok, the creative often drives campaign results more strongly than targeting settings. Media buyers frequently notice that a well-crafted video can outperform carefully defined audience segments. If the content fails to capture attention, even precise targeting struggles to generate engagement.
High-performing ads usually resemble organic TikTok content. Advertisers often rely on user-generated style videos, clear product demonstrations, or simple storytelling that shows how the product works in real situations. Quick pacing and varied visuals also help maintain viewer interest throughout the video.
Engagement Does Not Always Lead to Conversions
High interaction does not always translate into purchases. A video might collect large numbers of likes, comments, and shares while producing very few sales.
This situation usually appears when the content is entertaining yet fails to explain the product clearly or highlight a reason to buy. Viewers enjoy watching the clip, but the message does not move them toward action.
For this reason, advertisers study conversion data alongside interaction metrics. Sales, sign-ups, and click behavior reveal whether a campaign drives business results or simply attracts attention.
Creative Fatigue Occurs Quickly
Ad performance can decline within a short period once the same creative appears repeatedly in users’ feeds. As viewers encounter the video multiple times, attention drops and interaction levels begin to weaken.
Common warning signs appear in campaign metrics. Advertisers may notice rising CPM, lower click-through rates, and reduced return on ad spend. These shifts signal that the audience has already seen the creative too often.
To keep campaigns performing, advertisers regularly introduce new video variations and rotate fresh creatives into their ad sets.
Using Competitive Ad Intelligence to Improve TikTok Analytics Insights
Reviewing campaign analytics reveals how your ads perform, but it does not always show what is happening across the wider market. Important signals such as emerging product trends, competitor strategies, or new creative styles remain hidden when analysis stays limited to internal data.
Competitive ad intelligence platforms help fill that gap. These tools allow marketers to observe advertising activity across the platform and study creatives that already attract attention from audiences.
WinningHunter provides marketers with access to large collections of active advertisements and e-commerce store data. With this type of visibility, advertisers can
Review trending TikTok creatives
Observe competitor advertising patterns
Discover products gaining traction in campaigns
Monitor the performance of e-commerce stores
It tracks more than 100k+ TikTok ads and thousands of e-commerce stores. This data allows marketers to study successful campaigns and identify strategies that already perform well.
Turning TikTok Ad Analytics Data Into Campaign Optimization
Ad data shows what truly connects with viewers. Watch time, clicks, conversions, and revenue patterns quickly reveal which creatives deserve more attention and which campaigns need adjustment. Marketers who review these signals regularly gain a clear sense of what drives results.
Your own reports only tell part of the story.
WinningHunter fills that gap by exposing active ads, competitor strategies, and products gaining momentum. Instead of guessing the next campaign idea, you can study what already attracts attention and use those insights to build stronger ads.
FAQs
What metrics matter most in TikTok ad analytics?
Several indicators help measure campaign efficiency. Marketers usually watch click-through rate, CPM, conversion rate, cost per conversion, and return on ad spend. Together, these numbers reveal whether an ad attracts attention, drives traffic, and generates profitable results.
What is considered a good CTR for TikTok ads?
Click-through rate varies depending on industry, audience targeting, and creative style. Campaigns that perform well commonly report CTR values between 1% and 3%. Results above that range usually indicate a creative that captures attention effectively.
How do advertisers track conversions from TikTok ads?
Advertisers measure conversions through the TikTok Pixel installed on websites or through event tracking within mobile applications. These systems record actions taken after someone interacts with an ad, such as purchases, product views, add to cart events, or account registrations.


We already know what works before you even have the chance to blink!
© 2024 WinningHunter.com