winning-product-criteria
Winning Product Criteria: 10 Data Points That Actually Matter
By
Kinnari Ashar
You can spot a trending product in seconds. What you cannot see that quickly is whether it actually makes money.
Views, likes, and ad visibility create a false sense of certainty. They show attention, not outcomes. What matters sits behind those numbers, hidden in costs, conversion behaviour, and how the business holds up once real spend begins.
If you want products that scale, you need to look at pressure points. Can you bring in traffic without costs spiralling? Do visitors take action consistently? Does each sale leave enough margin after fulfilment, fees, and returns?
This guide breaks product validation into measurable signals you can actually act on. Each one ties directly to a decision you need to make.
Keep reading. What looks promising is not always what works.
What Makes a Product “Winning”?
A product is not proven when the idea sounds good. It earns that status when the full cycle works again and again. It brings in visitors, they take action, and the numbers still make sense after every cost is accounted for.
Consider a simple situation. You launch ads for a trending gadget, and clicks are cheap at first. Orders come in, but the conversion rate sits around average. As competition increases, your cost per click rises. The same conversion rate now produces a higher acquisition cost, and your margin starts to disappear. Nothing changed on the surface, yet the outcome shifts quickly.
Another case looks promising early on. Your store converts well because the offer is clear and the product solves a visible problem. But the average order value stays low. After payment fees, shipping, and returns, there is little left to reinvest. Growth stalls even though the funnel performs well.
You will also come across products with strong demand where everyone is selling something similar. Costs climb as more advertisers enter, and even solid creatives struggle to hold performance. What worked last week becomes harder to sustain.
This is where WinningHunter becomes useful. You are not guessing whether a product works. You are checking if it already runs inside a system that is under pressure.
Look for patterns that repeat across the market:
Ads that stay active over time, not campaigns that appear for a few days and disappear
Different stores are promoting similar offers with their own variations
Creative ideas that show up across multiple accounts, not just one isolated test
These signals do not guarantee success, but they show that the loop is already functioning somewhere. Your job is to understand why it works before you try to replicate it.
The 10 Data Points
1. Demand Level (Absolute Volume of Potential Buyers)
Start with a number, not a feeling. If this product goes live today, how many people can realistically buy it over the next few weeks?
That answer only makes sense when you measure demand using a fixed reference. Search-led products rely on keyword volume. Impulse-driven items depend more on how often they appear across ads and category traffic. When you validate through stores, the focus shifts to whether multiple sites are pulling consistent visibility over time.
To make this practical, break the demand into three parts. Traffic coming in, how that traffic converts, and the price customers accept. This gives you a simple way to test the strength of the opportunity.
For example, a product attracting 10,000 visitors a month with a 1% conversion rate and a £20 price point has a clear ceiling. Unless one of those variables improves, growth will stall quickly.
What matters next is consistency. A short spike can come from a single creator or a temporary push. It does not confirm real demand. Track interest over at least four to eight weeks to see whether activity holds once the initial attention fades.
Now bring competitors into the picture. Find a small group of stores selling the same product and watch what happens over time. Are they still running ads weeks later? Are new creatives appearing, or did activity slow down? Stable demand shows up as continued effort, not a one-time burst.
With WinningHunter, you can confirm whether the product appears across multiple active stores and whether those stores continue pushing it. That removes a large part of the guesswork.
2. Demand Momentum (Direction and Durability of Demand)
Momentum tells you when to enter, not just whether the product has demand.
Looking at daily movement creates noise. What matters is direction over time. Track demand weekly and compare it against the previous six to eight weeks to understand whether interest is building or fading.
A steady upward movement usually signals an early opportunity. A sharp spike followed by a drop often points to short-lived attention. Flat or inconsistent movement makes the outcome unpredictable.
To validate momentum properly, signals should align:
Search interest continues to rise over multiple weeks
Ad activity increases, not just appears briefly
New sellers enter the market, showing expanding competition
When only one of these moves is made, the signal is weak and often misleading.
A simple rule helps avoid poor timing. Do not act on a spike. Wait until momentum stays positive for several weeks before testing.
The common mistake is entering after the peak. At that stage, competition is already high, and costs start increasing while interest slows down.
3. Competitive Intensity (Acquisition Pressure and Saturation)
Competition shows up in your costs long before it shows up in your results.
Two products can look identical from the outside, yet behave very differently once you start spending. The difference usually comes down to how crowded the space is and how similar everyone’s approach looks.
A simple way to read this is by building a basic comparison layer:
Signal | What to Look For | What It Tells You |
Number of advertisers | How many sellers are actively promoting the product | More advertisers increase auction pressure |
Creatives per advertiser | How many ad variations each seller is running | High variation suggests ongoing testing and budget commitment |
Offer similarity | Pricing, bundles, messaging, positioning | Low differentiation makes it harder to stand out |
When these signals combine in a certain way, the outcome becomes predictable. A high number of advertisers using similar creatives and offers usually leads to rising costs. You are not just competing for attention, you are competing inside an auction where small differences matter.
For example, if ten stores are selling the same product with near-identical creatives, each new advertiser pushes costs higher. Even if your ad performs well, the margin gets tighter as competition increases.
To validate this properly, start by identifying how many unique stores are selling the same product. Then look at how they are promoting it. Are there multiple creative angles being tested, or is everyone repeating the same format? A high number of similar ads signals saturation, not strength.
Entry decisions become clearer once you view competition through cost pressure.
Entering a crowded market can still work, but only under certain conditions:
You introduce a clearly different angle that shifts how the product is presented
Your economics allow you to absorb higher acquisition costs through stronger order value
Ignoring this link between competition and cost is where most mistakes happen. Visibility may look strong, but rising acquisition pressure quietly removes your margin.
4. Competitor Traction (Proof of Revenue, Not Just Activity)
You don’t need more product ideas. You need proof that someone is already making money from one.
Start with this. Open five stores selling the same product.
What you are looking for is not design, not branding, not even the ads themselves. You are looking for behaviour. Do these stores keep pushing the product, or do they move on quickly?
If a store drops a product within days, something broke. Either the cost was too high, or the conversions did not hold. Stores do not keep spending on products that fail quietly.
Now look at how sales behave over time. One strong day means nothing. A short spike usually comes from a single push. What matters is whether the activity continues without needing that push again.
Here’s where it becomes useful. When you see three, four, or five different stores showing the same pattern, the risk changes. It is no longer one seller getting lucky. It starts to look like a system that works across different setups.
Situation | What It Actually Means |
One store is performing well | Could be timing, audience, or a one-off push |
Several stores are holding steady activity | Repeatable model, lower risk |
Stores appear and disappear quickly | Product fails to sustain performance |
Most people stop at the first example they find. That is where wrong decisions start. A single winner can mislead you. A group of consistent performers is much harder to ignore.
5. Target CPA (Economic Viability Constraint)
Before you run ads, answer this one question. How much can you afford to spend to get a customer?
Take your selling price. Subtract product cost, shipping, payment fees, and expected returns. The amount left is what you can spend on acquiring a customer.
Now check what it will actually cost.
If one click costs £0.25 and 2 out of 100 visitors buy, you need 50 visitors for one order. That means you spend £12.50 to get one customer. Now it becomes simple.
You spend £12.50 to get a customer, whereas you can only afford £8.
You start losing £4.50 on every order.
This is not something you fix later. The product fails at the numbers level.
One more thing most people miss. Returns and delivery issues reduce that £8 even further. If that happens, the loss increases as you scale.
6. Creative and Hook Performance (Attention Efficiency)
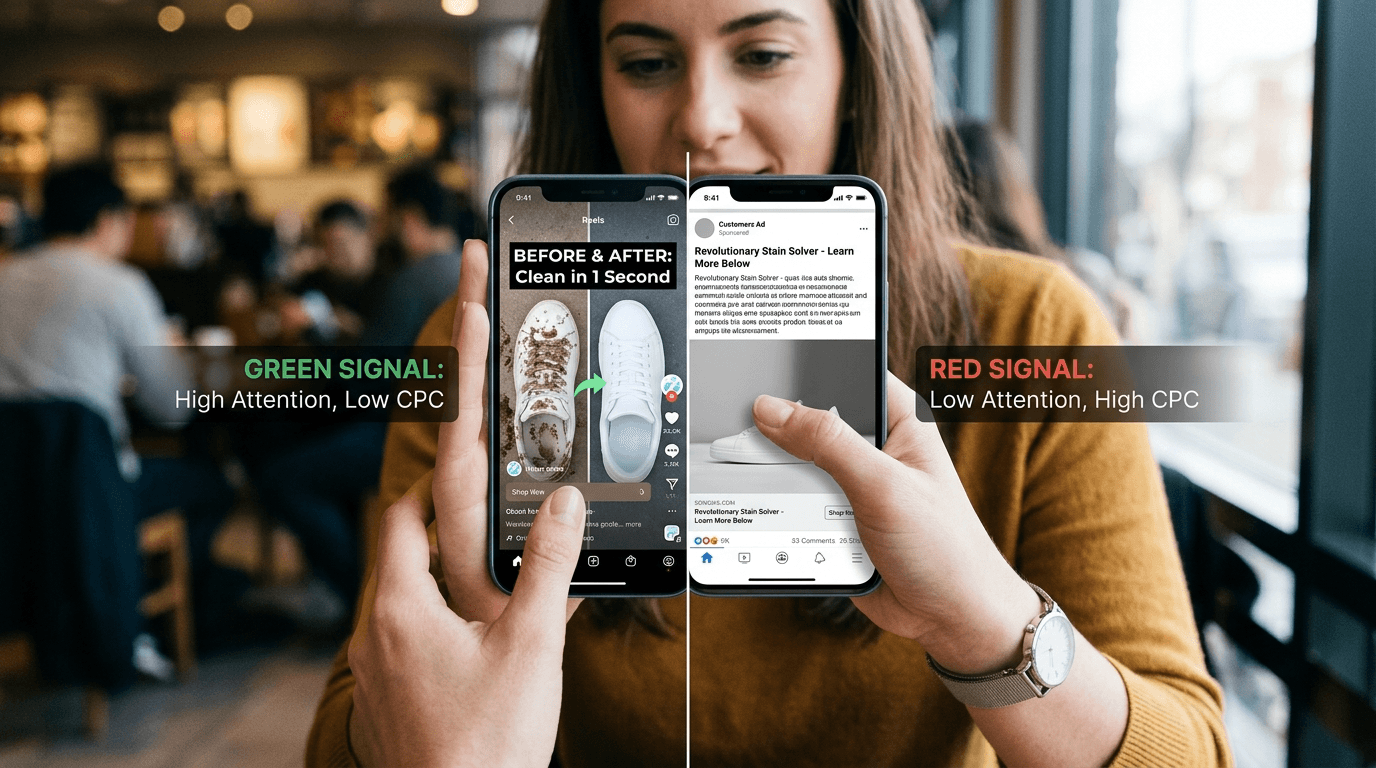
The cost of your traffic is decided before the click.
People scroll fast. If nothing happens immediately, the ad is ignored. When something grabs attention, clicks come easier, and costs drop.
The first seconds carry most of the weight. After that, the click rate shows whether attention turns into action. Cost per click reflects how expensive that attention is.
You need enough data before judging results. Around 1,000 impressions gives a stable read on click behaviour.
Strong hooks are easy to recognise. They show something clear without explanation.
Blocked sink, then water suddenly drains
Scratched surface, wiped once, and it looks new
Greasy pan, cleaned in one motion
Person reacting in real time after using the product
Side-by-side result where one fails and the other works
These work because the outcome is visible instantly. No setup, no thinking.
That instant clarity creates the “wow” effect. Some products have it built in. A visible change or unexpected result makes the ad easier to watch and easier to click. Products without that rely more on explanation, which increases testing cost.
When performance drops, the signal is direct. If people do not click, the angle is weak. If they do not stop, the hook fails.
7. Funnel Conversion Efficiency (Traffic to Revenue)
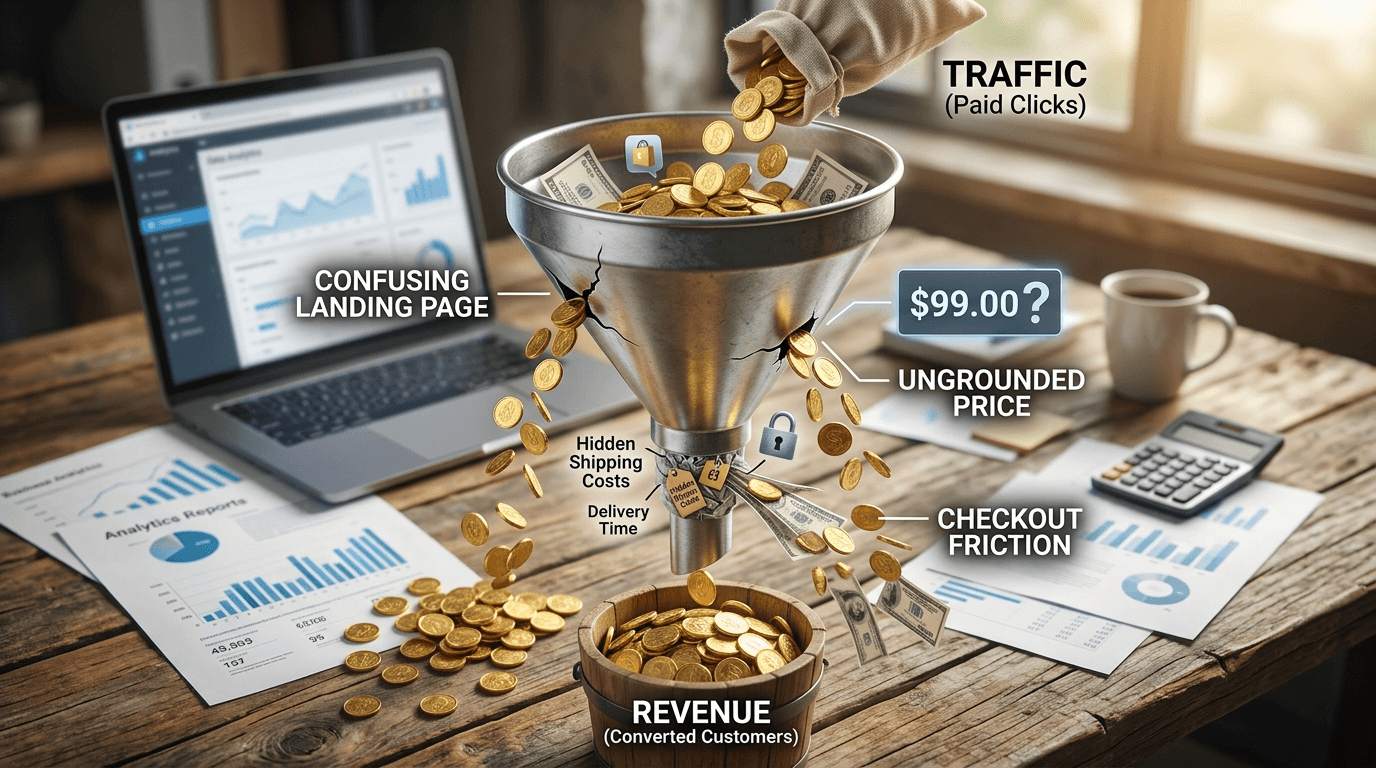
You paid for the click. The visitor lands. Then nothing happens. That moment is where money disappears.
Look at your page like a first-time buyer. No context, no patience. In a few seconds, they decide whether to stay. If the product isn’t clear in use and outcome, they leave.
Most pages delay the result. A banner, a headline, then the product shows up later. By then, attention is gone. Bring the outcome to the top. Show the product in action. One clear result. No thinking required.
If they stay, the next break happens at the price. Not because it’s high, but because it feels disconnected. There’s no anchor. Show what they get in one view. Bundle, comparison, or a clear before and after. Give the number meaning.
The last drop happens at checkout. They add to cart, reach the final step, then stop. This is friction. Shipping appears late. Delivery feels unclear. Payment feels uncertain. Show full cost early. Keep checkout tight. Add reassurance where payment happens.
Small data misleads. Wait until enough people move through the page. Around a thousand sessions is where behaviour stabilises.
A conversion range of one to three percent is commonly seen, but it is not a rigid target. Context, product type, and traffic quality change what “good” looks like.
If visitors move through without hesitation, the funnel works. If they stop, that point is the problem.
8. Monetisation Strength (Revenue per Order)
Revenue doesn’t improve just by getting more orders. It improves when each order carries enough value to support acquisition and still leaves room to grow.
Two stores selling the same product can end up in completely different positions. One keeps pushing traffic but struggles to stay profitable. The other scales with the same flow of visitors. The difference comes down to how much each customer is worth.
Average order value reflects what a customer spends per purchase. Revenue per session shows how much each visitor contributes overall. When both increase, the business gains flexibility. When they stay flat, every new customer becomes harder to afford.
Metric | What It Shows | Why It Matters |
Average Order Value | Revenue per order | Defines how much each customer is worth |
Revenue per Session | Revenue per visitor | Connects traffic directly to revenue |
The structure of the offer plays a direct role here. A single product limits spending. Bundles increase order size by grouping values. Upsells build on an existing decision, adding more after the customer has already committed.
That shift changes how much you can spend to acquire customers:
Higher order value gives more room to spend on ads
Lower order value restricts acquisition and slows scaling
Early results can mislead. A small number of orders does not reflect real behaviour. Once you reach around thirty to fifty purchases, patterns begin to stabilise, and decisions become more reliable.
A common mistake is pushing order value up while weakening margin. Heavy discounts, poorly structured bundles, or added costs can inflate revenue while reducing what you actually keep.
9. Retention and LTV (Long Term Value per Customer)
Most products make their money on the first order. Some make it on the second, third, and every purchase after that. That difference decides how far you can push acquisition.
A consumable product that gets reordered changes the equation completely. The first sale doesn’t need to carry the full profit because value builds over time. A one-time purchase doesn’t have that advantage. It has to recover costs immediately, or it breaks.
This directly affects how aggressively you can spend. Strong retention increases how much you can afford to pay for a customer. Weak or uncertain repeat behaviour forces you to stay conservative.
Measure this through repeat purchase rate and customer lifetime value. These numbers show whether customers come back or disappear after the first transaction.
Be careful with early signals. Repeat behaviour takes time to stabilise. Assuming customers will return without enough data leads to inflated expectations and poor decisions.
10. Returns and Operational Risk (Profit Leakage)
Profit doesn’t disappear at the ad level. It leaks after the purchase.
A product can look profitable on paper and still fail once orders start coming in. Returns, refunds, failed deliveries, and support issues quietly reduce what each sale is actually worth. These aren’t edge cases. They show up quickly when volume increases.
Return rate, refund rate, and delivery success rate tell you how much of your revenue you keep. High return rates cut directly into the margin. Disputes and chargebacks create a different problem. They affect payment processors and can limit your ability to run ads.
Track what happens after the sale. Support tickets, refund requests, and delivery delays reveal problems early.
You need enough volume to trust the signal. Around 100 orders give a clearer picture. Ignoring post-purchase experience during validation turns profitable products into losses.
How do the 10 Data Points Connect?
These data points don’t sit independently. They follow a sequence, and each step removes a different type of risk before you move forward.
Demand → Competition → Ads → Funnel → Profit → Retention
Demand comes first. If there aren’t enough buyers, nothing else matters. Competition follows. Even with demand, a crowded space increases acquisition pressure and reduces margin.
Ads come next. This stage decides whether you can capture attention at a workable cost. After that, the funnel takes over. Traffic either converts into orders or drops off.
Profit sits after conversion. Revenue per order must cover acquisition and operational costs. Retention comes last. It determines whether value builds over time or stops at the first purchase.
Each stage acts as a filter:
Early stage removes weak ideas
Mid-stage exposes inefficient ads and funnels
Late stage reveals whether the product can scale
Skipping a step pushes the problem forward, where it becomes more expensive to fix.
How to Build a Winning Product Scorecard?
A scorecard is not a report. It’s a filter.
You’re taking one product idea and running it through the same set of checks every time. Each data point answers a specific question. If the answer is weak, you don’t move forward. If it holds, you move to the next stage.
The mistake most people make is tracking numbers without defining what those numbers mean. A scorecard only works when every metric has a fixed definition and a clear interpretation. Otherwise, the same product can look “good” or “bad” depending on how you read it.
Before using any data, keep one rule consistent. Use the same base across all measurements, sessions should always mean the same thing, and revenue should be measured the same way each time. Small inconsistencies here lead to wrong decisions later.
Here’s how the scorecard should be read. Each row represents one checkpoint. You are not analysing everything at once. You are moving step by step.
Data Point | What You Check | What You’re Asking | What Good Looks Like |
Demand | Search, traffic | Are enough people interested | Holds over multiple weeks |
Momentum | Growth trend | Is interest increasing | Consistent upward movement |
Competition | Sellers, ads | How crowded is the space | Room to differentiate |
Traction | Revenue signals | Are others succeeding | Multiple stores consistent |
CPA | Acquisition cost | Can you afford customers | Within margin |
Ads | CTR, CPC | Do people respond | Stable engagement |
Funnel | Conversion flow | Do visitors complete a purchase | No major drop-offs |
Monetisation | Order value | How much each customer spends | Supports acquisition |
Retention | Repeat behaviour | Do customers return | Measurable repeat rate |
Risk | Returns, refunds | Do you keep the revenue | Margin remains stable |
Once each data point is defined, the next step is to make the scorecard usable.
Assign a score from 1 to 5 to each data point. A score of 1 reflects weak performance, 3 indicates acceptable conditions, and 5 represents strong validation. This keeps evaluation consistent across different products.
When all scores are added, the total gives a quick direction:
40 to 50 suggests the product is ready to scale
30 to 39 indicates improvement is needed before scaling
Below 30 signals that the product is not worth pursuing
The total helps with direction, but it does not override critical failures. Some metrics carry more weight. If acquisition cost does not fit within margin, the product fails regardless of how strong the other signals look.
For example, demand scores 4, competition sits at 3, funnel performance comes in at 4, but acquisition cost scores 2. The total reaches 33, which points toward iteration. So you know, the issue is not the product itself, but how efficiently it can acquire customers.
The workflow stays simple. You take an idea, map it against this structure, test with real data, and then decide.
When to Kill, Iterate, or Scale

Decisions become easier when each signal points in the same direction. You are not guessing here. You are reading what the data is already telling you.
Kill the product when the numbers don’t hold even after adjustments. If the acquisition cost stays above what the margin allows, the model is broken. If demand rises and falls without consistency, it won’t support sustained growth. Pushing further only increases loss.
Iteration comes into play when some parts work, and others don’t. If ads are getting clicks but the page fails to convert, the issue sits in the funnel. If traffic is steady but the order value stays low, the offer needs restructuring. These are fixable problems, but only if the underlying demand and attention are already present.
Scaling only makes sense when the system holds under pressure. Acquisition cost stays within limits, conversion behaviour remains stable as traffic increases, and multiple competitors show consistent performance. At that point, the product is not relying on a single condition. It’s operating within a model that can repeat.
A Product Only Wins When the System Holds
Products don’t fail because they lack attention. They fail because decisions rely on partial signals.
Views without cost, clicks without conversion, sales without margin. Each one shows a piece, but none of them is enough on its own. That’s where mistakes begin.
The ten data points in this guide work as a system. Demand shows whether buyers exist. Competition sets the pressure. Ads bring attention, the funnel converts it, monetisation supports it, and retention extends it. When these align, outcomes become predictable. When they don’t, scaling turns into guesswork.
This is what separates a product that looks promising from one that actually works.
If you want to move faster, the process needs structure. Instead of searching manually and connecting scattered signals, WinningHunter brings key inputs together. You can see which products are already being pushed, how ads are performing, and how competitors behave across stores.
This changes how decisions are made. You validate before spending, not after.
The goal is to filter faster and scale only what holds.
FAQs
How many data points should you check before testing?
You don’t need all ten before starting, but a few are non-negotiable. Demand, competition, ad response, and CPA feasibility should be clear. If these don’t hold, testing usually leads to wasted spend rather than useful insights.
What’s the most common mistake in product validation?
Relying on what’s visible. Ads, views, and engagement create the illusion of success, but they don’t show cost, conversion, or margin. Decisions made on visibility alone often fail once real money is involved.
Why does Target CPA matter so much?
It defines the limit of your model. If your acquisition cost goes beyond what each order can support, scaling becomes impossible. No amount of creative testing or optimisation fixes a broken cost structure.
Can a product work in a crowded market?
It can, but only with a clear advantage. Either the product is positioned differently, or the economics allow higher acquisition costs. Without that, competition increases pressure and reduces your ability to stay profitable.
Do all products need repeat purchases?
No, some products rely entirely on the first sale. However, when repeat purchases exist, they increase customer value over time. That gives you more flexibility in acquisition and makes scaling more sustainable.


We already know what works before you even have the chance to blink!
© 2024 WinningHunter.com